Comparison
Martech Stack Builder vs Spreadsheets
Spreadsheets (Google Sheets, Excel) are the #1 tool teams use for Martech stack tracking. But flat rows and columns can't show relationships, data flows, or architecture health.
The quick verdict
Spreadsheets are where most Martech stack tracking begins -- and where it stays stuck. A flat list of vendor names, costs, and owners can't show you how tools connect, where data flows, or whether your architecture is sound.
Stack Builder transforms that flat list into a living, visual architecture with AI analysis, while still letting you track the details that matter. Use both together: spreadsheets for the data, Stack Builder for the architecture.
Feature Comparison
| Feature | Martech Stack Builder | Spreadsheets |
|---|---|---|
| Visual architecture diagram | ✓ | — |
| Data flow visualization | ✓ | — |
| 100+ Martech vendor library | ✓ | — |
| AI Stack Evaluation | ✓ | — |
| Multi-Lens Views | ✓ | — |
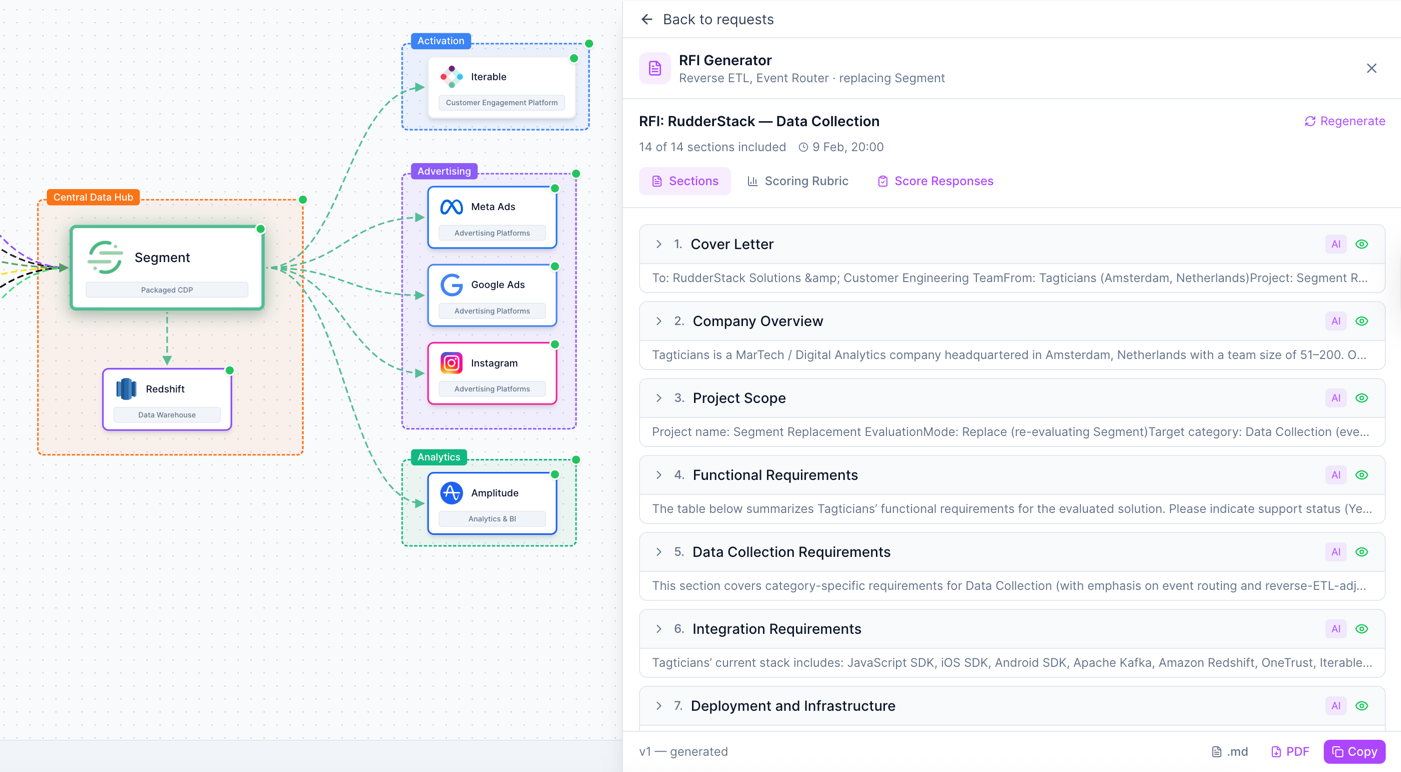
| RFI Generator | ✓ | — |
| Custom formulas & calculations | — | ✓ |
| Pivot tables & data analysis | — | ✓ |
| Cost tracking | Cost Lens view | ✓ |
| Vendor inventory list | ✓ | ✓ |
| Collaboration | Team plan | ✓ |
| Export options | PNG, PDF, JSON | CSV, XLSX, PDF |
| Free tier | ✓ | Google Sheets free |
Why Martech teams choose Stack Builder
Visual architecture vs flat rows
See how tools connect, where data flows, and how your stack is structured -- not just a list of names in cells. A visual architecture reveals integration gaps, data silos, and redundancies that are invisible in a spreadsheet.
- Drag-and-drop nodes with connections showing data flow
- Instantly spot integration gaps and data silos
- Stakeholder-ready diagrams, not screenshots of cells
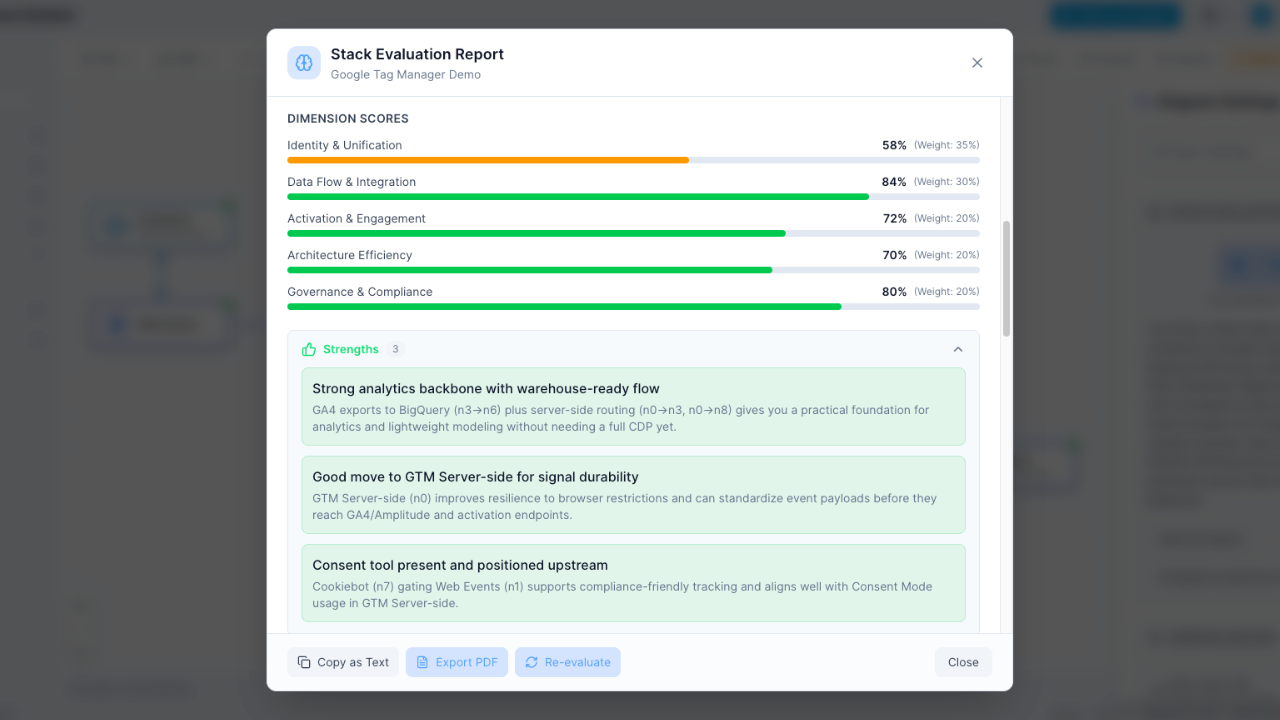
AI analysis vs manual review
Stack Builder's AI evaluates architecture health, identifies redundancy, and grades your stack. Spreadsheets just store the data -- they can't tell you if your architecture has gaps, overlaps, or governance risks.
- Instant A-F grades across 5 architecture dimensions
- Automated redundancy detection across your stack
- Actionable recommendations, not just raw data
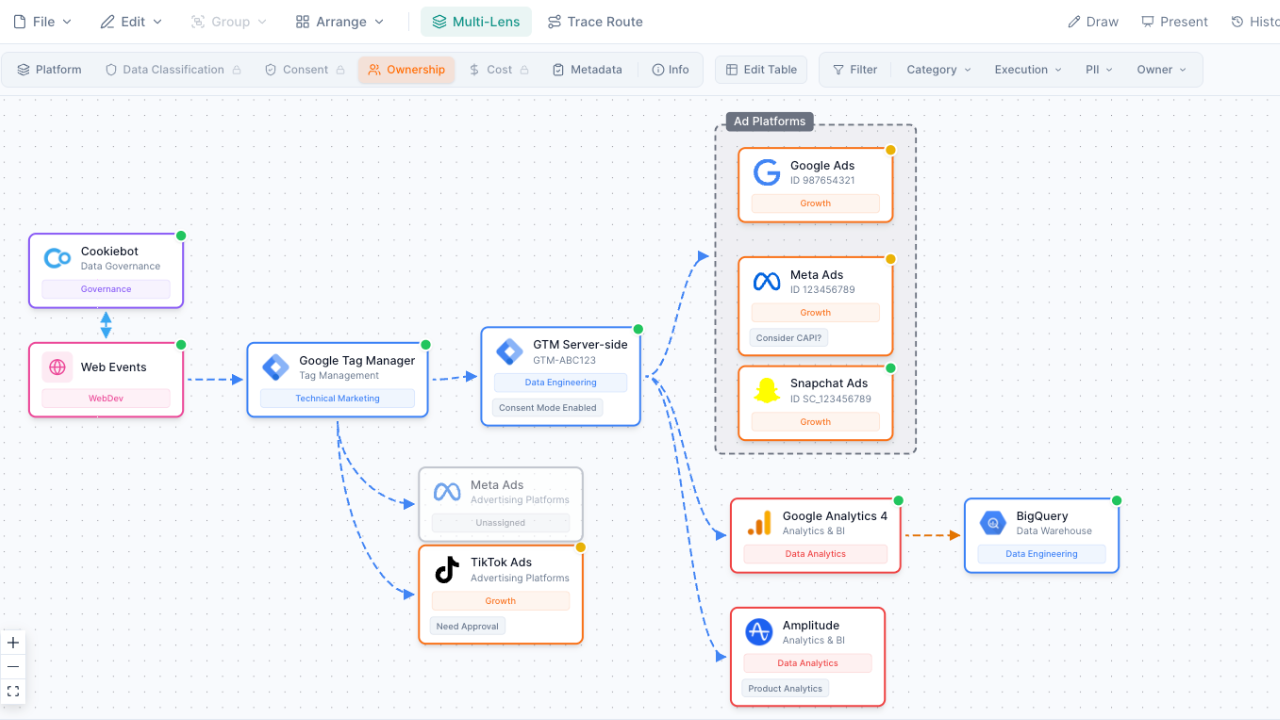
Interactive exploration vs scrolling
Click any node to trace data flows, switch lenses for different perspectives, and explore your stack visually. In a spreadsheet, you're scrolling rows and cross-referencing tabs to understand how things connect.
- Click-to-trace data flows between any two tools
- Switch between ownership, cost, data, and consent lenses
- Zoom, pan, and focus on any part of your architecture
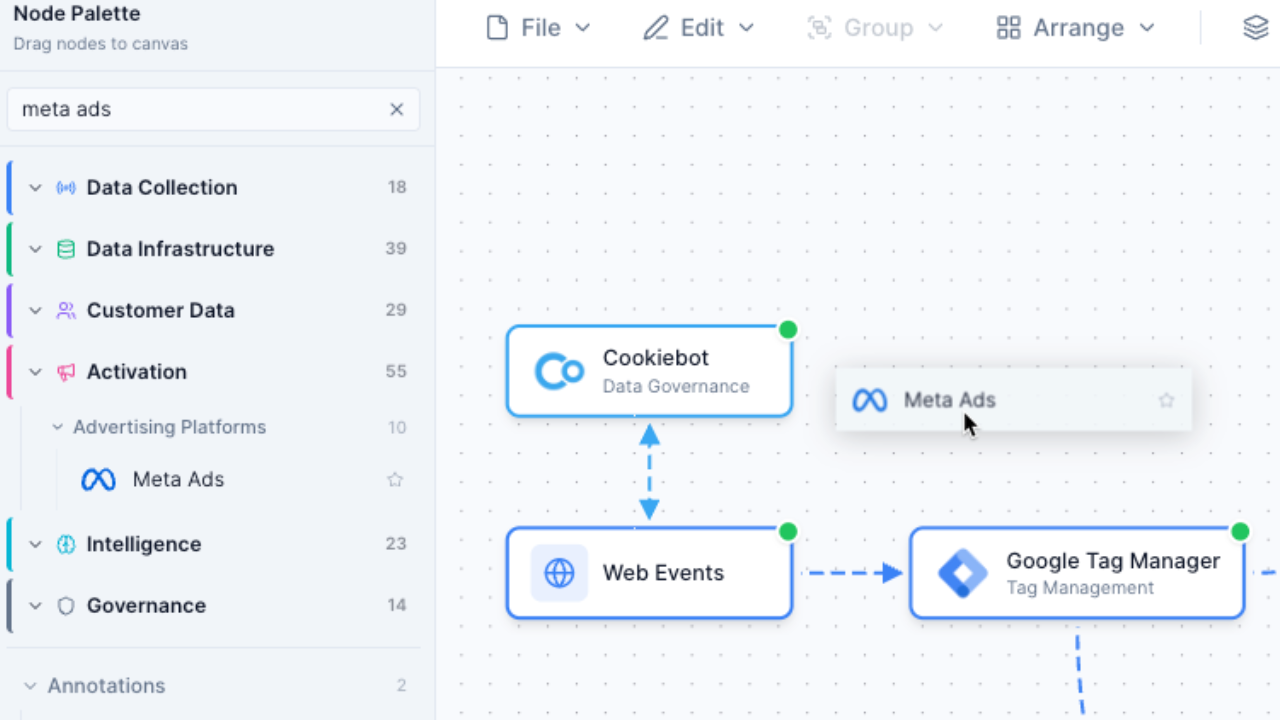
Built-in vendor intelligence
100+ vendors with logos, categories, and metadata already included. No need to manually build and maintain a vendor registry in your spreadsheet -- just search and drag onto your canvas.
- Pre-built nodes for Segment, HubSpot, Salesforce, and 100+ more
- Vendor logos and category metadata maintained for you
- Smart search by vendor name, category, or function
When to use Spreadsheets instead
Spreadsheets remain the best tool for certain Martech management tasks. Choose spreadsheets when you need:
- Detailed cost tracking with custom formulas -- sum, average, and forecast your Martech spend with calculations that update automatically
- Vendor contract management -- track renewal dates, license counts, contract terms, and compliance deadlines in structured rows
- Large dataset analysis with pivot tables -- slice and dice vendor data across departments, regions, and cost centers
- Quick data entry for inventory purposes -- rapidly log new tools, update statuses, and maintain a running list of your Martech investments
But when the task is specifically Martech stack architecture -- visualizing how tools connect, evaluating your stack's health, and planning future integrations -- Martech Stack Builder gives you the visual and analytical layer that spreadsheets can't.
Frequently Asked Questions
Can I import my spreadsheet into Stack Builder?
Should I stop using spreadsheets entirely?
Can Stack Builder track costs like a spreadsheet?
How do teams typically use both together?
Is Stack Builder more expensive than Google Sheets?
Can I export Stack Builder data to a spreadsheet?
Go beyond rows and columns
Transform your Martech inventory from a flat spreadsheet into an interactive, AI-analyzed architecture diagram.
No credit card required. Free plan available.