The Martech Stack Diagram Tool Built for Architects
Your stack architecture lives in one person’s head. When they’re in a meeting, on holiday, or leave the company — that knowledge goes with them. Put it on a canvas that the whole organization can see, question, and improve.
Why visualize your Martech stack?
Average number of Martech tools in an enterprise stack (Gartner)
Only a third of Martech tools are fully utilized (Gartner)
Most teams have no visual map of their complete architecture
A Martech stack visualization isn't just a pretty picture. It's the foundation for every strategic decision — consolidation, vendor evaluation, compliance audits, and budget optimization. Without a clear visual map, you're making decisions in the dark.
Three steps to a complete stack diagram
From blank canvas to presentation-ready architecture in minutes.
Build
Drag vendors from our 150+ library onto an infinite canvas. Search by name or category. Connect tools to show data flows, API integrations, and system dependencies.
Evaluate
Run the evaluation to get an A-F grade computed from duplicated capability, the overlapping pairs named, the spend at risk, and a keep/evaluate/remove call per tool. See exactly where the stack is paying twice.
Share
Export presentation-ready PNG or PDF for stakeholders. Use multi-lens views to show different perspectives — cost distribution, data flows, team ownership — from the same diagram.
Purpose-built for Martech architecture
Not a generic diagramming tool. Every feature is designed for marketing technology teams.
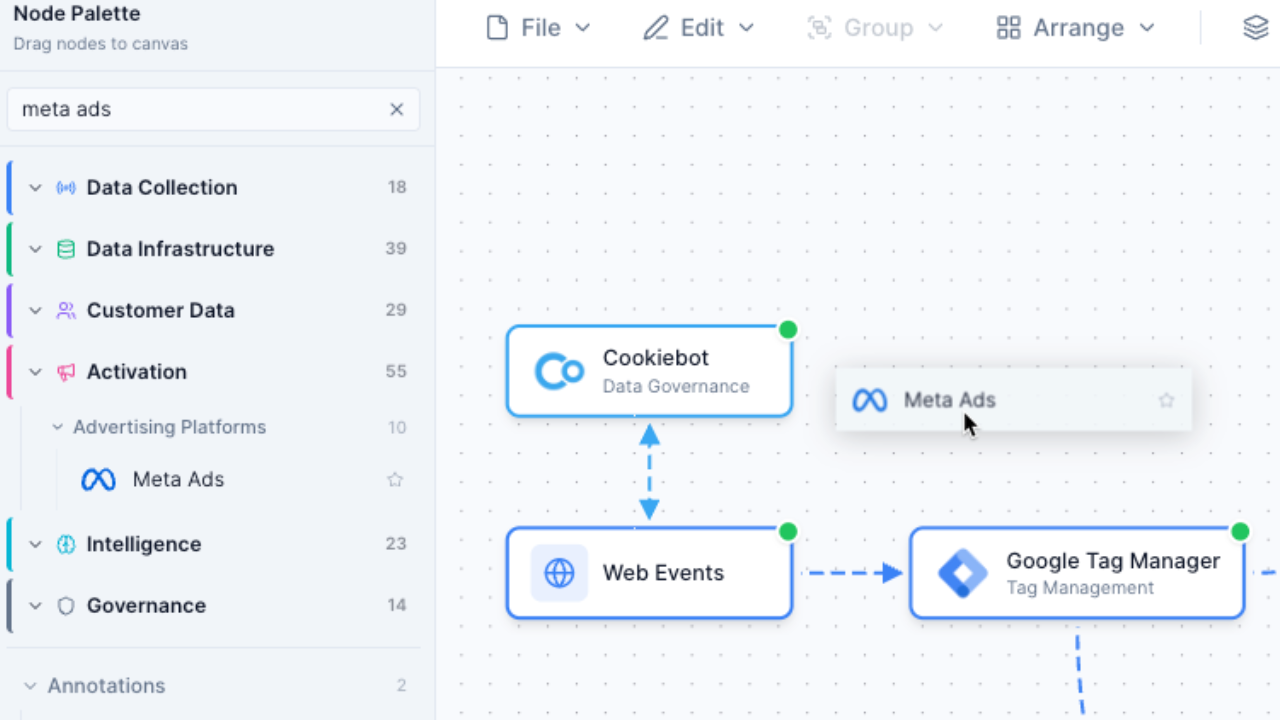
150+ Pre-Built Vendor Nodes
Every major Martech vendor with logos, categories, and metadata. Segment, HubSpot, Salesforce, Google Analytics, and 150+ more. No manual logo hunting or shape drawing.
- Pre-built nodes with official logos
- Organized by category (CDP, CRM, Analytics, etc.)
- Search by name or category
- Metadata includes pricing and capabilities
Data Flow Connections
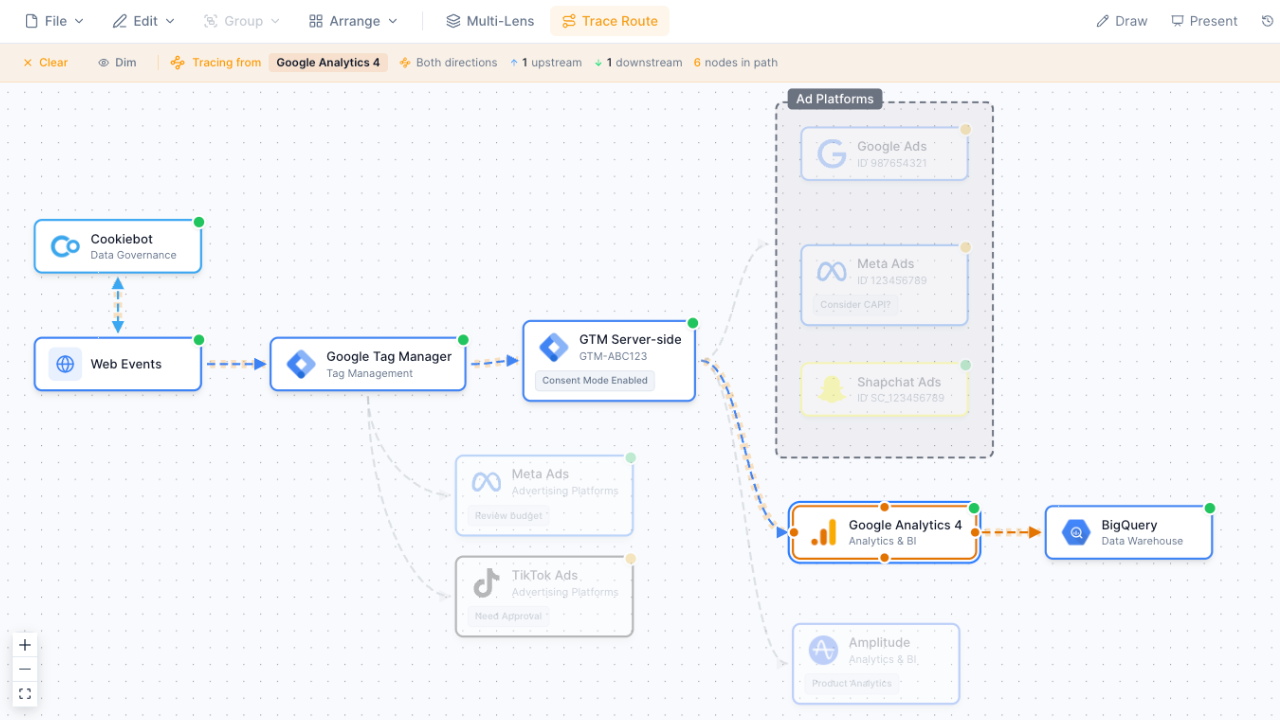
Draw connections between tools to show how data moves through your stack. Label edges with data types, protocols, and integration methods. Click any node to trace the full data path.
- Drag to connect any two nodes
- Label connections with data types
- Trace upstream and downstream flows
- Visualize API, webhook, and batch integrations
Multi-Lens Views
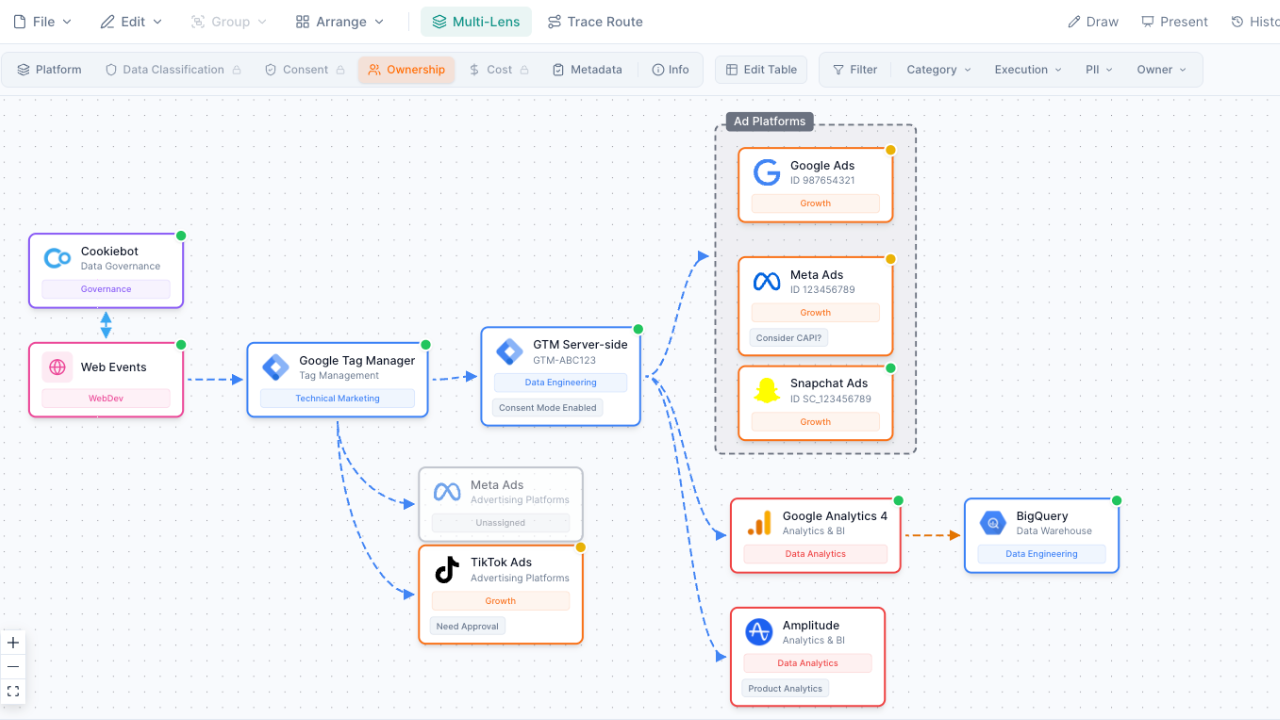
View your stack through 5 analytical lenses: Platform Architecture, Team Ownership, Data Classification, Consent Governance, and Cost Analysis. Each reveals different insights without creating separate diagrams.
- Platform Architecture for system overview
- Team Ownership for accountability mapping
- Data Classification for PII visibility
- Consent Governance for compliance auditing
- Cost Analysis for spend breakdown
AI-Powered Evaluation
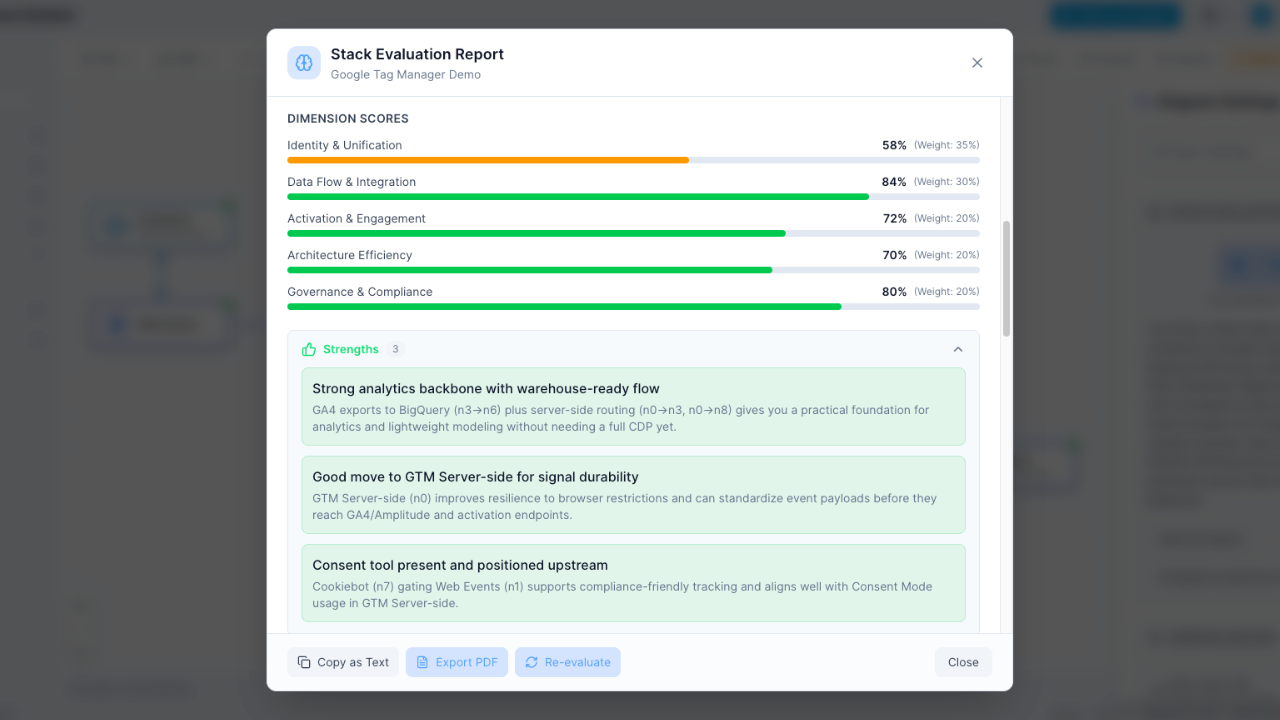
The engine grades your stack A-F on duplicated capability, and the AI explains the result. Get named overlaps, the spend attached to them, and a verdict per tool.
- An A-F grade at a glance, computed not guessed
- Overlapping tools named, with the reviewed judgment behind each pair
- The spend attached to the duplication
- A keep, evaluate or remove call per tool
Start from a template
Don't start from scratch. Choose from pre-built templates for common Martech architectures — e-commerce stacks, B2B lead gen, enterprise CDP setups, and more.
The method
Map your stack by hand
A stack map is worth drawing badly before it is worth drawing well. The value is in the arguments it starts, not the aesthetics. An hour with a whiteboard.
-
Put the system of record in the middle
Whatever holds the customer identity goes at the centre. If two things claim to, put both down and draw a line between them — you have just found your most important architectural question.
-
Place sources on the left, activation on the right
Data comes in from the left, goes out to channels on the right. Anything you cannot place on that axis is either infrastructure or does not belong.
-
Draw arrows in the direction data actually moves
Not the direction the vendor diagram shows. If you are unsure which way a connection runs, mark it with a question mark and leave it — those question marks are the most valuable marks on the page.
-
Label each arrow with how and how often
API or batch, real-time or nightly. An unlabelled arrow is an assumption, and assumptions about freshness are where campaigns go wrong.
-
Circle everything with only one arrow
A tool with a single connection is either a dead end or a silo. Both are worth a conversation.
Financial services, 12 tools, drawn on a whiteboard in 40 minutes.
| Tools placed | 12 |
|---|---|
| Arrows drawn | 19 |
| Marked with "?" | 6 |
| Single-connection tools | 3 |
| Systems claiming identity | 2 |
Reading it: Six question marks out of nineteen connections means a third of the stack works in ways nobody present could describe. Two competing identity systems is the finding that reorganises the roadmap.
The shortcut: The builder keeps the map live and versioned, so the question marks get resolved once rather than re-drawn each quarter.
Frequently Asked Questions
What is a Martech stack visualization?
How is this different from drawing in Miro or PowerPoint?
How long does it take to build a stack diagram?
Can I visualize data flows between tools?
What does the AI evaluation measure?
Is there a free plan?
Can I use this for the Martech Stackies?
Start visualizing your stack
Build your first Martech architecture diagram in minutes. Free to start, no credit card required.
No credit card required. Free plan available.