Stack Consolidation
Cut the Right Tools. Keep the Ones That Matter.
Everyone knows you have too many tools. The hard part is proving which ones to cut without breaking something. See overlaps, trace dependencies, quantify savings — and make consolidation decisions your CFO and your engineers can both support.
No signup needed — tick your tools, see overlaps and recoverable spend instantly.
The consolidation imperative
The numbers tell the story. Stack sprawl has hit a tipping point.
59%
of marketers are actively consolidating their stacks (2025 industry survey)
$100K+
average annual hidden cost of redundant Martech tools
91 tools
average enterprise Martech stack size (and growing)
Stack sprawl is the defining Martech challenge of 2026. Budgets are tightening, tools overlap, and nobody can confidently answer 'what would break if we removed this tool?' Stack Builder helps you move from gut feeling to data-driven consolidation.
Four steps to confident consolidation
A structured workflow to go from stack chaos to a clear consolidation plan.
Map your complete stack
Build a visual inventory of every tool, how they connect, and what data flows between them. See the full picture before making any cuts.
Identify overlaps
The evaluation computes which tools duplicate each other, capability by capability, and the Utilization lens shows seats bought against seats used. See which tools serve the same function and which are critical path.
Analyze cost impact
The Cost lens shows what each tool costs per month. The evaluation puts a recoverable-spend range on the overlaps, from the costs you enter, or category benchmarks where you have not entered one.
Build your consolidation plan
Use multi-lens views to understand the full impact of removing a tool — data flow disruption, team dependencies, and cost savings. Export your plan for stakeholder approval.
Purpose-built for stack consolidation
Tools that turn consolidation from a political minefield into a data-driven process.
Visualize Tool Overlaps
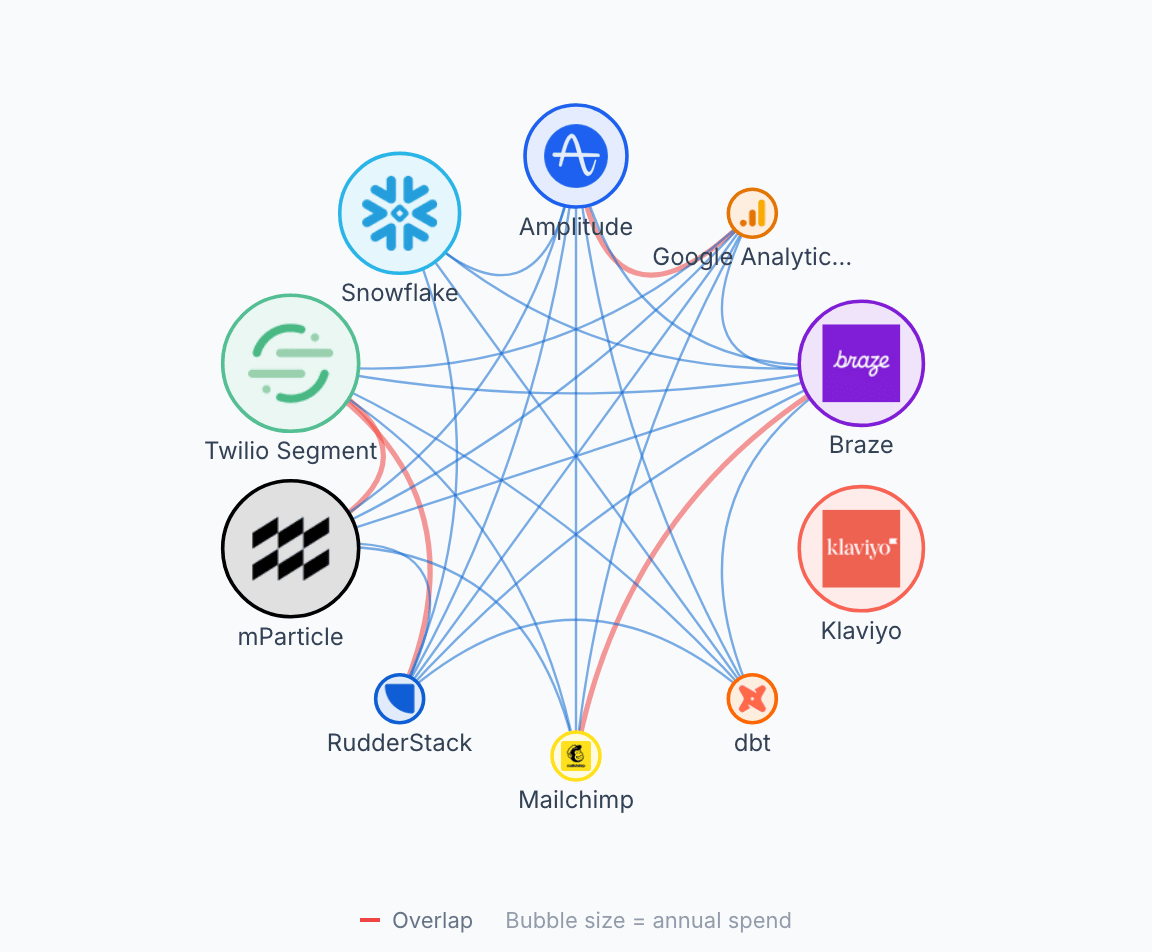
When multiple tools serve the same function, it's hard to see in a spreadsheet. On a canvas, next to the evaluation, they are hard to miss. Filter by category, trace data flows, and identify which tools are truly redundant.
- See which tools share capabilities
- Trace data flow to understand dependencies
- Identify critical-path vs. redundant tools
- Filter the canvas by category
Computed Redundancy Detection
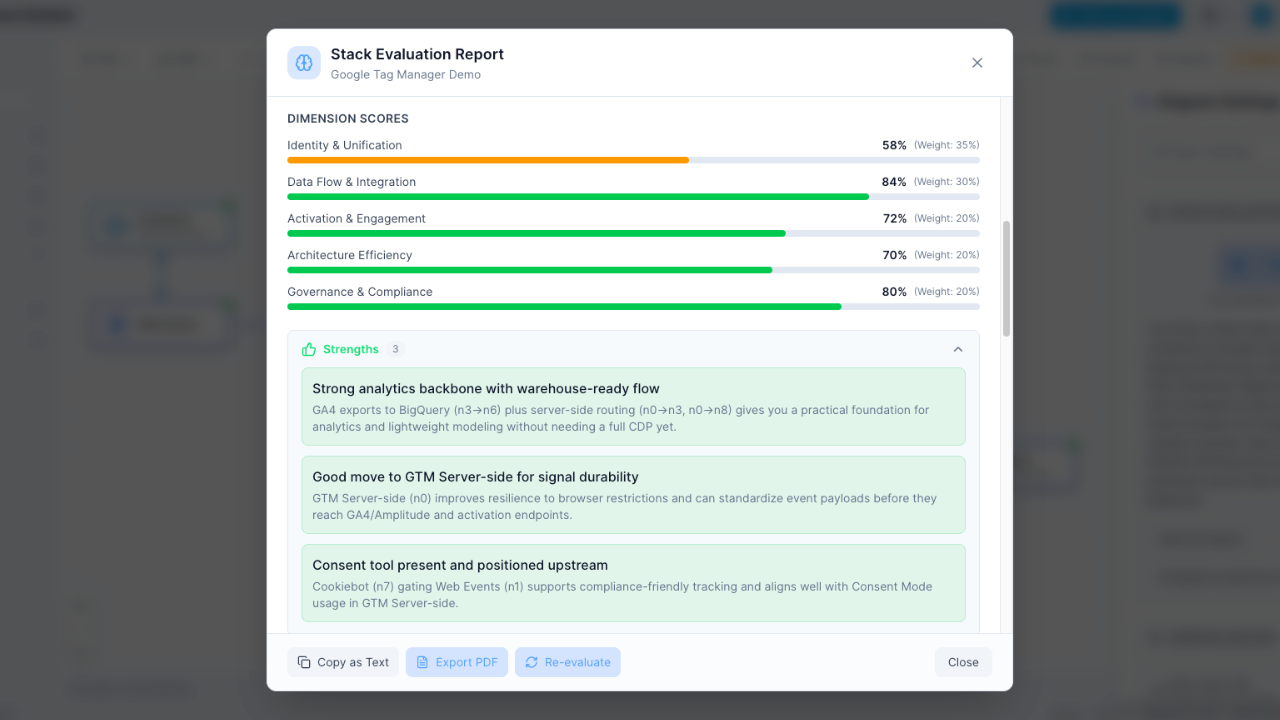
The evaluation compares every pair of tools against a capability taxonomy of 134 capabilities and a stored verdict on each vendor pair, so a complement is not counted as waste. It names the overlaps, grades the stack A–F and gives a keep, evaluate or remove call per tool. The AI explains the findings; it does not produce them.
- Automatic redundancy identification
- Specific consolidation recommendations
- Single points of failure and orphaned tools
- Recoverable spend, as a range
Cost Lens and Stack Costs
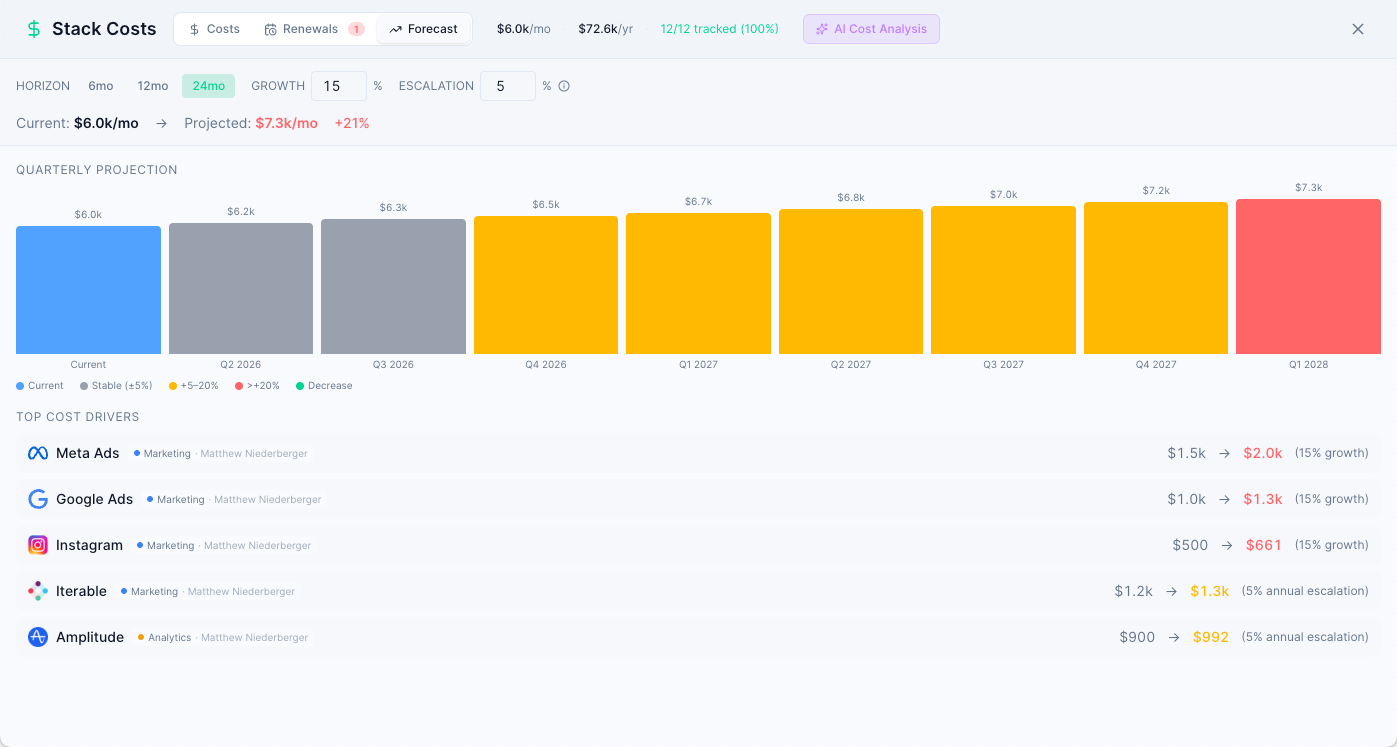
Switch to the Cost lens to see what each tool costs per month, right on the diagram. On Consultant, Agency, Team and Enterprise, the Stack Costs panel adds spend by department, a renewal calendar and a forecast. Build a business case with the numbers you entered.
- Monthly cost on every tool
- Recoverable spend from the overlaps
- Renewals and forecast in Stack Costs
- Data for budget conversations
The method
Build the consolidation case by hand
Consolidation fails when it is argued as tidiness. It succeeds when each cut has a named owner, a migration cost and a date. Allow a day, most of it spent on step 3.
-
Group tools by the job they do
Not by vendor category — by the outcome someone needs. Anything with more than one tool in a group is a consolidation candidate.
-
List the capabilities each tool in a group actually provides
Tick the capabilities each one covers. The overlap is the intersection; the risk is what only the tool you plan to cut can do. That column is the one that kills naive consolidations, so fill it in honestly.
-
Price the migration, not just the licence
For each candidate cut: licence saved, minus rebuild effort, integration rework, retraining, and the contract you cannot exit until renewal. A cut that saves $2k a month and costs six weeks of engineering is not a cut this year.
-
Sequence by renewal date
Order the surviving candidates by contract end. Consolidation is a calendar problem — the best case you cannot act on for eleven months goes below the mediocre one renewing in six weeks.
-
Name an owner and a date for each
An unowned consolidation is a wish. One name, one date, one success measure per cut.
Retail stack, two email platforms and two analytics tools in overlapping groups.
| Capability overlap, email pair | 68% |
|---|---|
| Only on the tool being cut | 2 capabilities |
| Combined licence | $4,200/mo |
| Estimated recoverable | $1,900/mo |
| Migration effort | ~4 weeks |
| Earliest exit | renewal in 5 months |
Reading it: A 68% overlap looks decisive until the 2 unique capabilities are named and the exit date is five months out. This is a real cut, but it is next-half work with a rebuild attached — not a quick win.
The shortcut: The stack evaluation computes step 2 from the capability taxonomy rather than a workshop, and prices each overlap from the costs you have entered.
Frequently Asked Questions
How does Stack Builder help with consolidation?
Can AI identify which tools to cut?
What if we cut a tool and something breaks?
How do I get buy-in from leadership?
How long does a consolidation analysis take?
Can we track consolidation progress over time?
Is there a free plan?
Map your stack and find what to cut
Visualize overlaps, quantify redundancy, and build a data-driven consolidation plan. Free to start.
No credit card required. Free plan available.