For Martech Managers
Your Stack Knowledge Shouldn't Live in One Person's Head
When the CTO asks "what would break if we cut Segment?" — you need a clear answer, not a 30-minute explanation. Build a living architecture that everyone from IT to finance can understand, question, and trust.
Problems you know too well
Managing a growing Martech stack means fighting the same battles over and over. Here's how Stack Builder fixes them.
Stack sprawl with no single view
Your stack has grown to 20, 40, 80+ tools and there's no single place to see how they all connect. Stakeholders ask 'what tools do we use?' and you're digging through spreadsheets.
How Stack Builder solves this
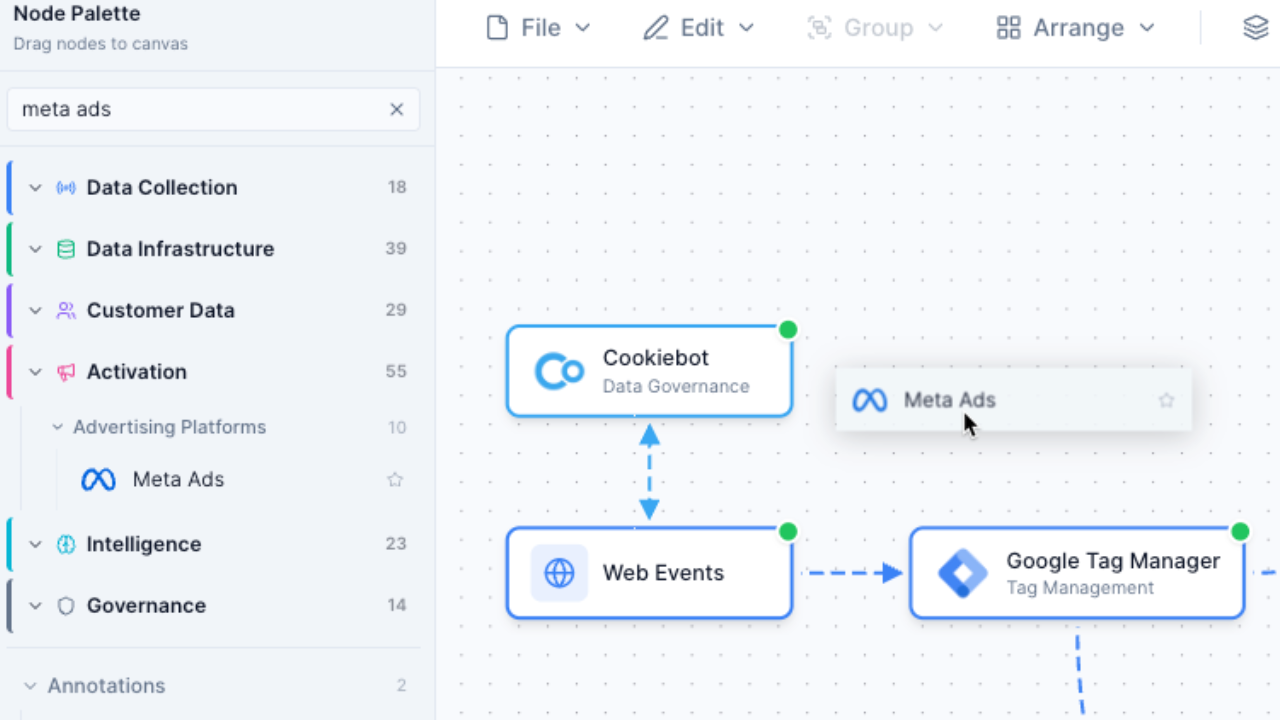
Build your complete stack visually with 100+ pre-built vendor nodes. See every tool, every connection, every data flow in one interactive diagram.
Can't quantify stack health
You know something's off -- redundant tools, poor integrations, data silos -- but you can't put a number on it. Budget conversations become opinion battles.
How Stack Builder solves this
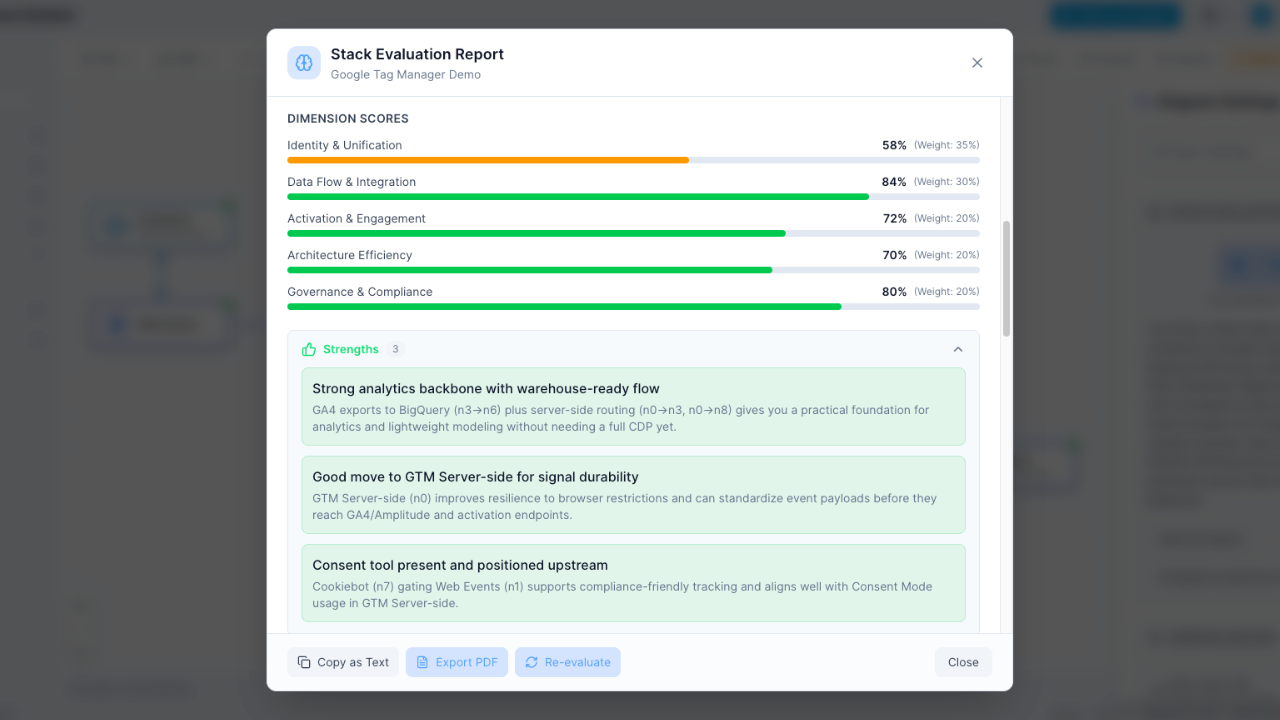
AI Stack Evaluation grades your architecture A-F across 5 dimensions. Walk into budget meetings with data, not opinions.
Hard to get buy-in for changes
You want to consolidate tools, but leadership needs to see the impact. PowerPoint diagrams don't convey the complexity.
How Stack Builder solves this
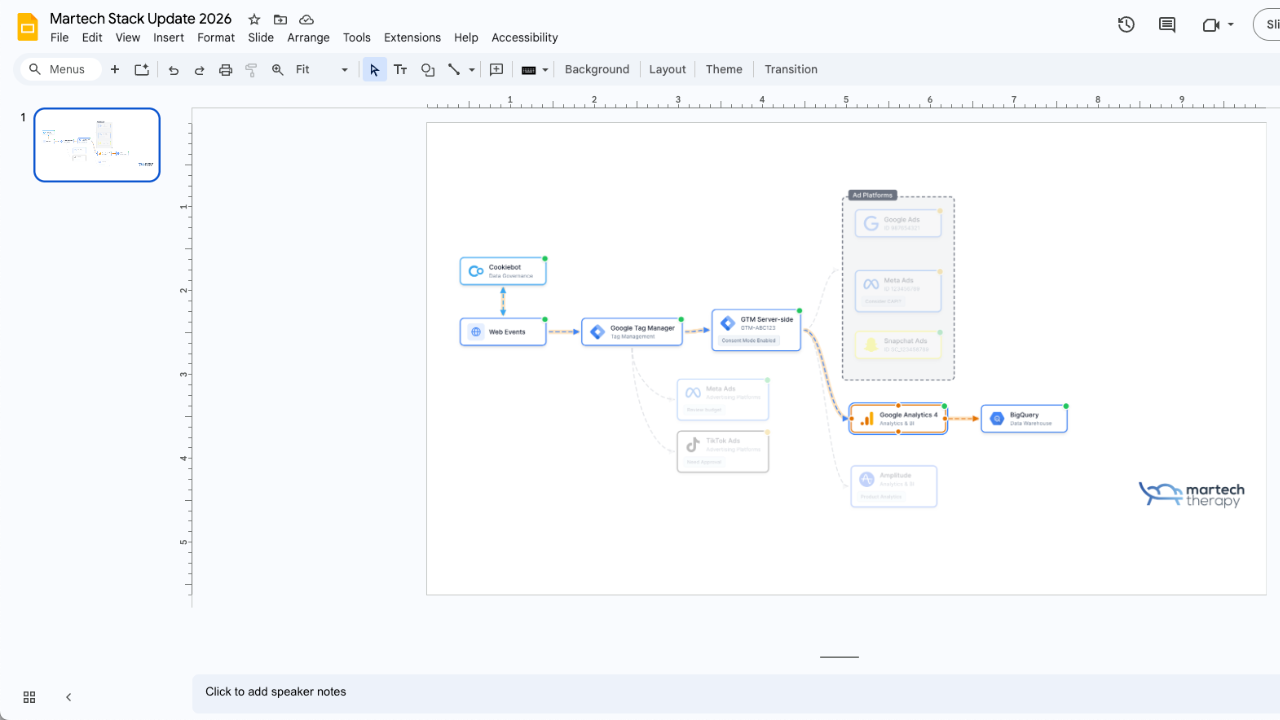
Export presentation-ready diagrams, share multi-lens views showing cost and data flow, and use AI-generated recommendations to build your case.
No visibility into data flows
GDPR audit coming and you can't trace where customer data goes across your 50-tool stack.
How Stack Builder solves this
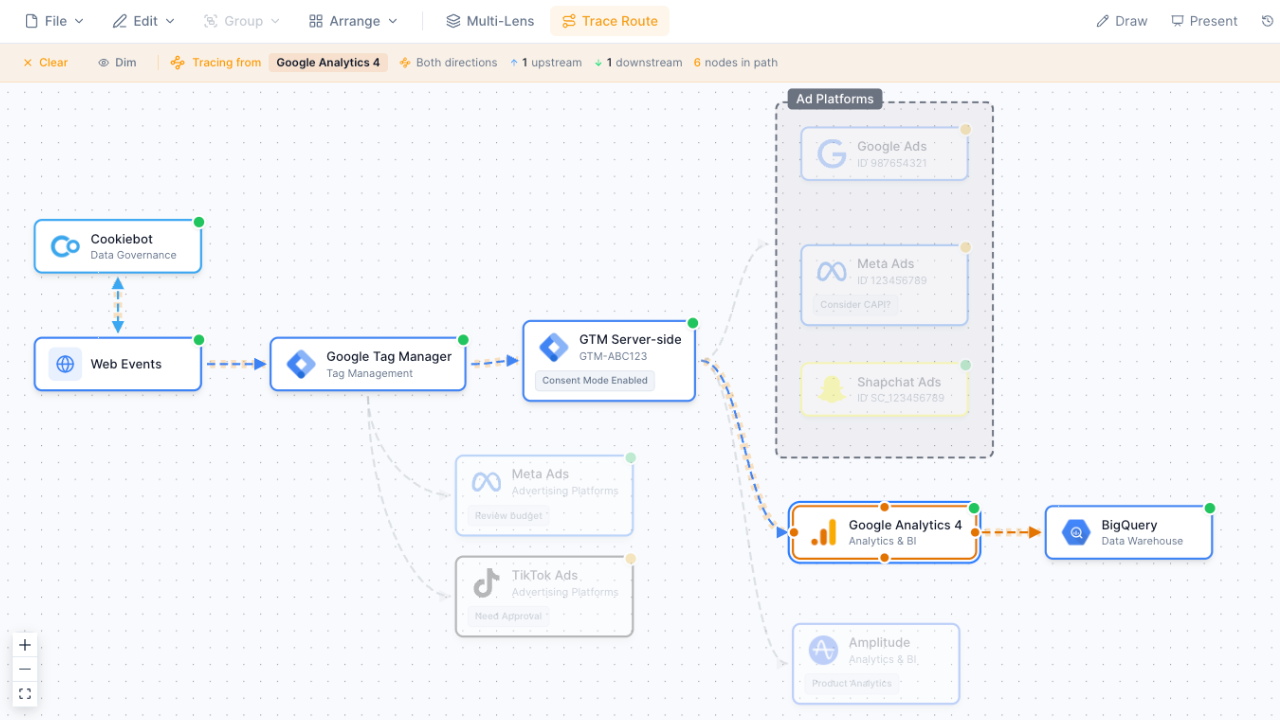
Trace Data Flow lets you click any node and instantly see upstream sources and downstream destinations. The Consent Governance lens highlights compliance gaps.
Key features for Martech managers
Purpose-built tools that make your job easier, not harder.
Visual Stack Builder
Drag 100+ vendor nodes onto an infinite canvas. Connect tools to show data flows.
- Pre-built vendor nodes with logos
- Custom nodes for internal tools
- Hub Nodes for grouping systems
AI Stack Evaluation
Get A-F grades for Integration Health, Data Governance, Cost Efficiency, Scalability, and Security.
- Letter grades at a glance
- Actionable recommendations
- Identify gaps and redundancies
Multi-Lens Views
Switch between Platform, Ownership, Data Classification, Consent, and Cost views.
- 5 analytical perspectives
- PII and data classification visibility
- Cost distribution analysis
Export & Present
High-res PNG, PDF export for stakeholder presentations. Remove watermarks on Pro.
- Presentation-ready output
- PNG, PDF, and JSON formats
- Clean exports without watermarks (Pro)
How it works
Go from scattered spreadsheets to a living architecture diagram in three steps.
Build your stack
Drag vendors from our 100+ library onto the canvas. Connect them to show data flows.
Evaluate with AI
Run AI evaluation to get letter grades and recommendations for your architecture.
Share with stakeholders
Export presentation-ready diagrams or share interactive links with your team.
A day in the life with Stack Builder
See how Martech managers use Stack Builder to turn complexity into clarity.
9:00 AM -- CMO asks about stack redundancies
Open your stack diagram, run AI Evaluation, and share the letter grades showing two overlapping tools in the analytics layer. Total time: 5 minutes.
11:00 AM -- Legal needs a data flow audit
Switch to the Consent Governance lens and use Trace Data Flow to show exactly where PII travels. Export a PDF for the compliance team.
2:00 PM -- Budget review for new CDP
Use the Cost Analysis lens to show current spend distribution, then duplicate the diagram and model the proposed architecture side by side. AI Evaluation scores both versions so leadership can compare.
Frequently Asked Questions
How many vendors can I add?
Can I share diagrams with stakeholders who don't have an account?
How accurate is the AI evaluation?
What if my vendor isn't in the library?
Can I track costs in Stack Builder?
Is my stack data secure?
See your stack clearly for the first time
Build a living Martech architecture diagram with AI evaluation. Free to start, no credit card required.
No credit card required. Free plan available.